Solutions For Wave/Selective
Solutions For Wave/Selective
Download the demo/latest versions of our profiling software by visiting our resource portal - Solderstar Central
Wave Central is a natural extension to the Profile Central concept, allowing for existing users of Profile Central to be analysing their wave or selective soldering in a matter of minutes. This dedicated tool package has been specifically designed for users of through-hole soldering machines, streamlining the whole procedure of machine calibration and daily testing. All tools are included for profile analysis, reporting and SPC chart generation.


Profile Explorer automatically stores downloaded profiles against the user's product name, creating a chronological record of profiles for each wave soldering process they wish to analyse.
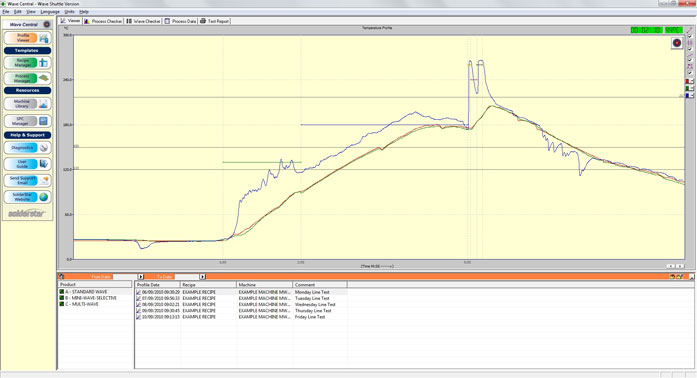
Wave Central automatically takes captured temperature profile data and calculates all the process parameters of interest, plotting them against pre-defined production limits to give an instant view on machine heater performance.
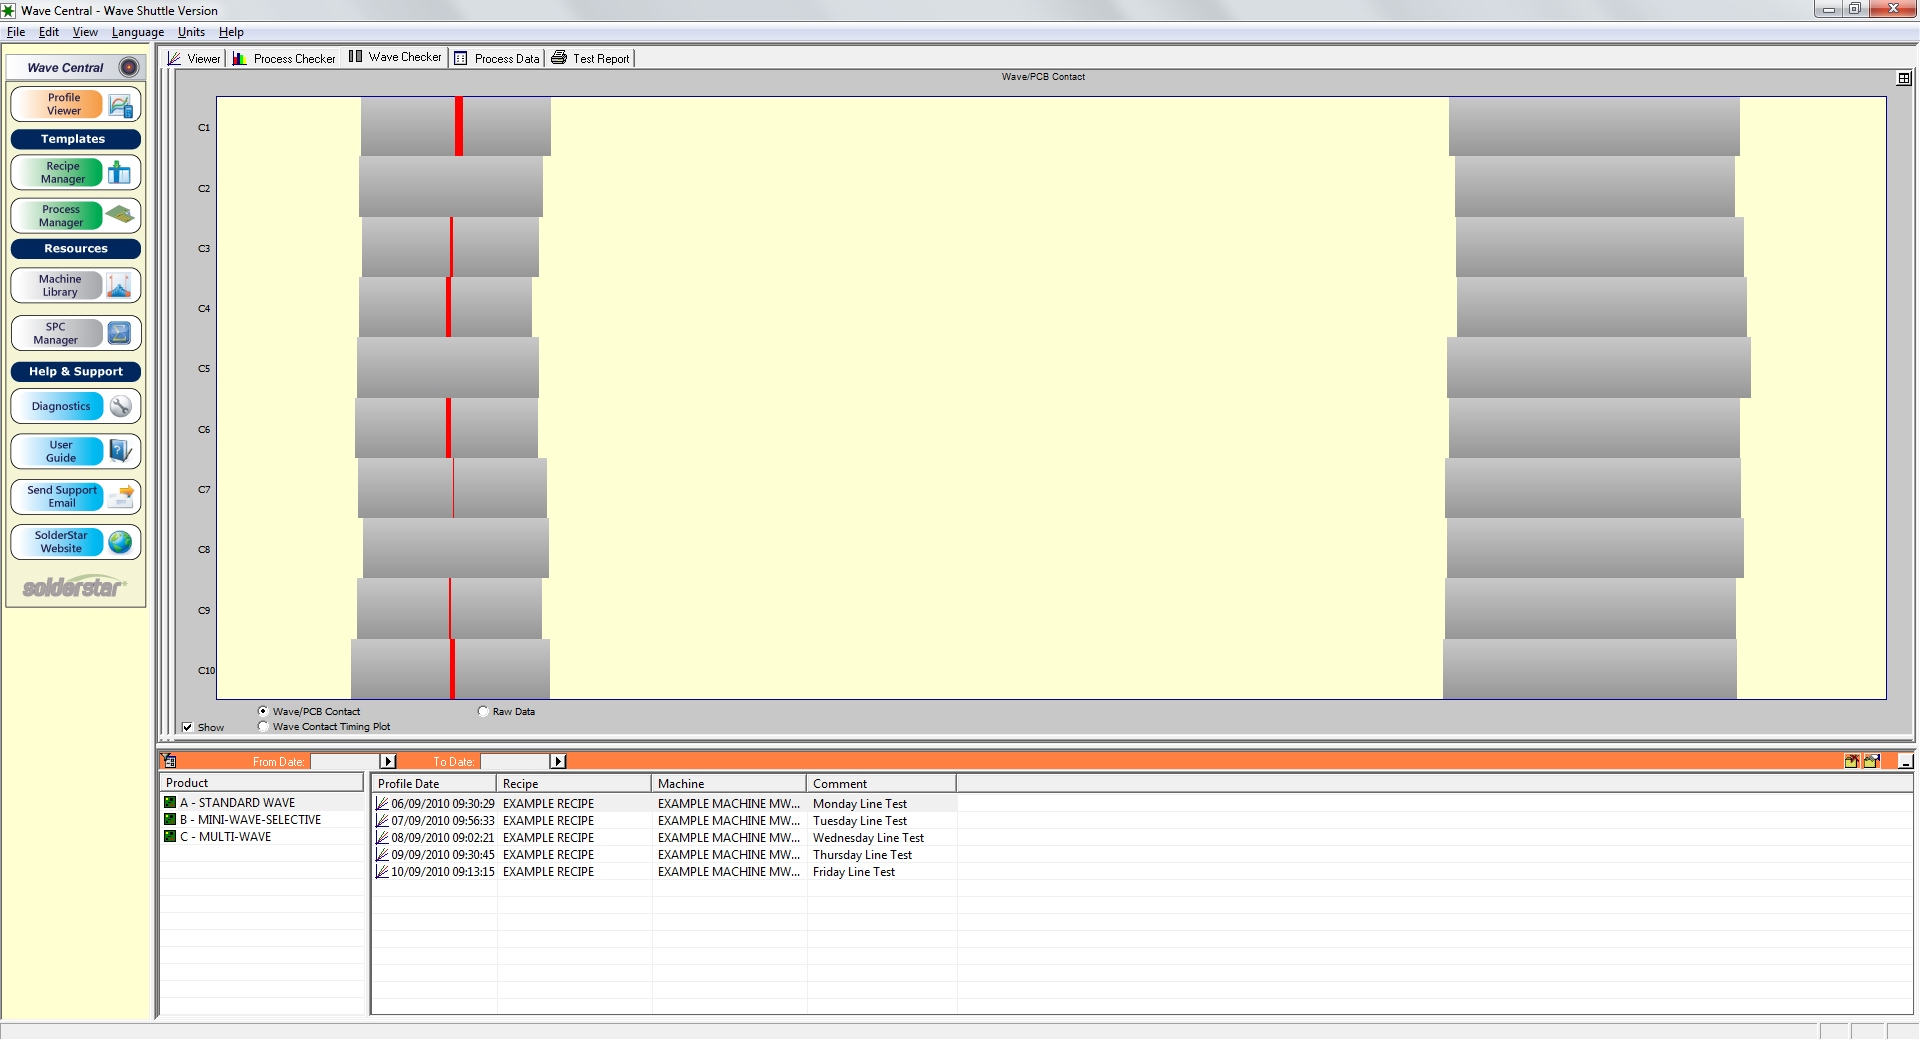
Correct solder wave contact parameters are crucial to obtaining high quality production soldering of electric assemblies. Wave Central displays in-depth information captured from Solderstar wave or selective soldering products which provide the highest levels of measurement accuracy available for these process types. Parameters such as wave height, wave parallelism and contact time can be measured and verified with the click of a mouse.
The Process Manager functions within Wave Central provides all the necessary tools for the engineer to manage and configure profiling limits for each of the wave soldering process in use within the manufacturing lines. Bespoke production settings can be configured for each individual soldering process to allow simple daily testing.
Professional, configurable test reports and process documentation can be generated at the click of a mouse. Reports on products, recipes and machine settings, temperature profiles and process checker graphs can be printed out or emailed.
Process trends can be monitored and process yields and quality can be improved through continuous SPC. Using SPC Manager, users can evaluate process trends for profiles selected from the database, illustrating these on professional Xbar and Range charts that include Cp, Cpk and control limits. Charts can be output in hard copy or digital format.